Short Answer
The following figure is a graph of a derivative function,  . Indicate on the graph the x-values that are critical points and label each as a local maximum, a local minimum, or neither.
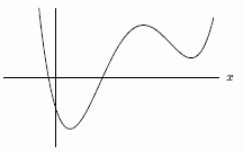
Correct Answer:
Verified
Related Questions
The following figure is a graph of a derivative function, . Indicate on the graph the x-values that are critical points and label each as a local maximum, a local minimum, or neither.
Correct Answer:
Verified


