Short Answer
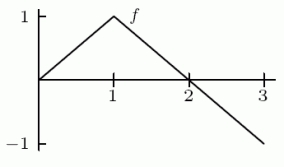
The graph of f is shown in the following figure. Find  if
if  and
and  .
. 
Correct Answer:
Verified
Related Questions
Q61: The marginal cost in dollars per unit
Q62: The marginal cost function of producing a
Q63: The following table gives the rate
Q64: Use the following figure to find the
Q65: If Q67: Suppose Q68: The graph below shows a marginal cost Q69: If a function is concave up, then Q70: The graph of Q71: The graph of Unlock this Answer For Free Now! View this answer and more for free by performing one of the following actions Scan the QR code to install the App and get 2 free unlocks Unlock quizzes for free by uploading documents![]()
![]()
![]()
![]()

