Harley Davidson (ticker symbol HOG) stock prices dropped sharply in late 2008. Series 1 in the graph below shows the actual prices at the end of each week. The trend over time is approximately linear; and the graph of a possible linear model is given by Series 2. Based on the data given, find the linear model and use it to approximate the stock's price on November 30, 2008, assuming the current trend continued. 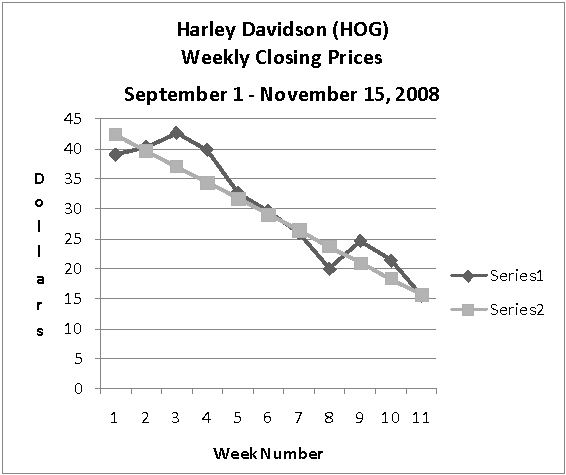
Correct Answer:
Verified
View Answer
Unlock this answer now
Get Access to more Verified Answers free of charge
Q8: Find a formula for the linear function
Q9: Let Q10: A graph of Q11: A school library opened in 1980. In Q12: A school library opened in 1980. In Q14: A car is worth $15,000 when it Q15: A furniture moving company charges a fixed Q16: From the following table, Q17: Suppose that Q18: The average weight in pounds of American Unlock this Answer For Free Now! View this answer and more for free by performing one of the following actions Scan the QR code to install the App and get 2 free unlocks Unlock quizzes for free by uploading documents![]()
![]()
A. Find f(4)
B. Find![]()

