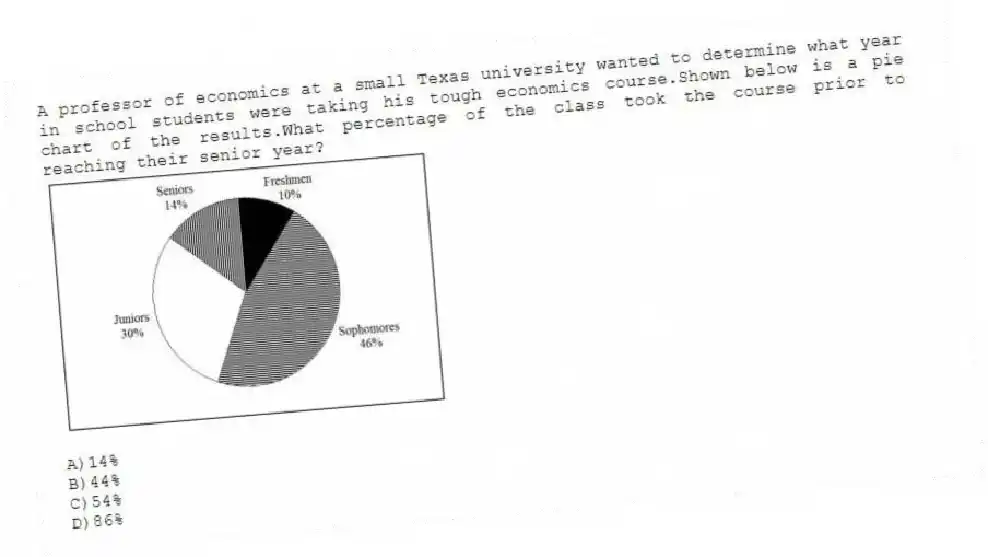
A professor of economics at a small Texas university wanted to determine what year in school students were taking his tough economics course.Shown below is a pie chart of the results.What percentage of the class took the course prior to reaching their senior year? 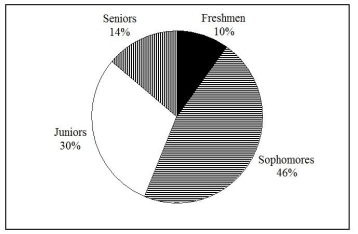
A) 14%
B) 44%
C) 54%
D) 86%
Correct Answer:
Verified
Q2: TABLE 2-1
An insurance company evaluates many numerical
Q4: TABLE 2-3
Every spring semester, the School of
Q5: TABLE 2-2
At a meeting of information systems
Q11: When constructing charts,the following is plotted at
Q13: SCENARIO 2-2
2-2 Organizing and Visualizing Variables
At a
Q19: TABLE 2-1
An insurance company evaluates many numerical
Q20: When polygons or histograms are constructed,which axis
Q125: The British Airways Internet site provides a
Q127: Jared was working on a project to
Q138: A statistics student found a reference in
Unlock this Answer For Free Now!
View this answer and more for free by performing one of the following actions

Scan the QR code to install the App and get 2 free unlocks

Unlock quizzes for free by uploading documents