TABLE 13-1
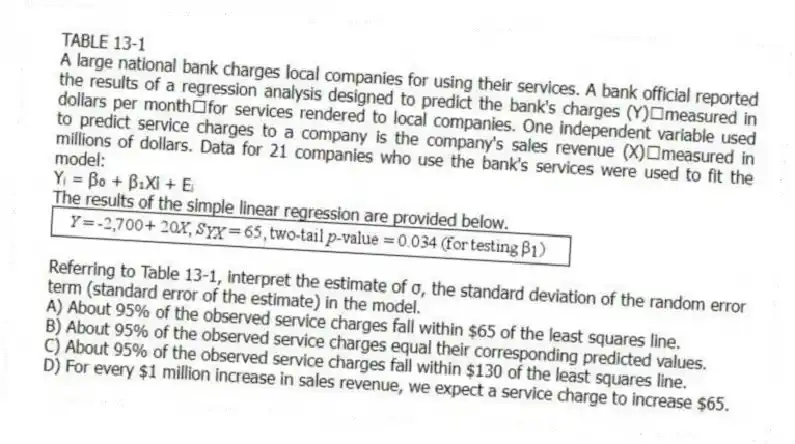
A large national bank charges local companies for using their services. A bank official reported the results of a regression analysis designed to predict the bank's charges (Y) measured in dollars per monthfor services rendered to local companies. One independent variable used to predict service charges to a company is the company's sales revenue (X) measured in millions of dollars. Data for 21 companies who use the bank's services were used to fit the model:
Yᵢ = β₀ + β₁Xi + Eᵢ
The results of the simple linear regression are provided below.

-Referring to Table 13-1, interpret the estimate of σ, the standard deviation of the random error term (standard error of the estimate) in the model.
A) About 95% of the observed service charges fall within $65 of the least squares line.
B) About 95% of the observed service charges equal their corresponding predicted values.
C) About 95% of the observed service charges fall within $130 of the least squares line.
D) For every $1 million increase in sales revenue, we expect a service charge to increase $65.
Correct Answer:
Verified
Q9: Referring to Table 13-2, to test whether
Q10: TABLE 13-2
A candy bar manufacturer is interested
Q11: TABLE 13-2
A candy bar manufacturer is interested
Q12: The Y-intercept (b₀) represents the
A) predicted value
Q13: Referring to Table 13-2, to test that
Q15: TABLE 13-1
A large national bank charges local
Q16: TABLE 13-2
A candy bar manufacturer is interested
Q17: TABLE 13-2
A candy bar manufacturer is interested
Q18: Referring to Table 13-2, what is the
Q19: TABLE 13-2
A candy bar manufacturer is interested
Unlock this Answer For Free Now!
View this answer and more for free by performing one of the following actions

Scan the QR code to install the App and get 2 free unlocks

Unlock quizzes for free by uploading documents