A restaurant manager tracks complaints from the diner satisfaction cards that are turned in at each table. The data collected from the past week's diners have been plotted and appear in the following graph. The number of complaints for each category is with each bar. 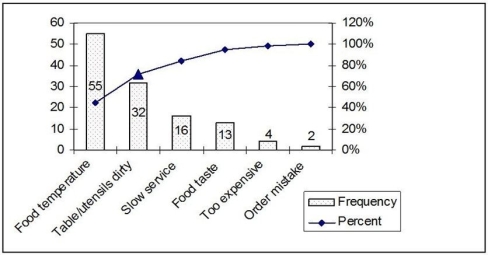
How was the value for the point represented by the triangle calculated?
A)
B)
C)
D)
Correct Answer:
Verified
Q195: The sales team has just finished creating
Q196: The time added to adjust for factors
Q197: Consider the four steps in a time
Q198: A(n) _ shows processing steps grouped according
Q199: How can flowcharts and process charts be
Q201: An existing insurance application process requires manual
Q202: Brainstorming sessions can be effectively conducted on
Q203: An undergraduate business student studies diligently in
Q204: A group of people, who are knowledgeable
Q205: Scenario 2.5
A job consists of three distinct
Unlock this Answer For Free Now!
View this answer and more for free by performing one of the following actions

Scan the QR code to install the App and get 2 free unlocks

Unlock quizzes for free by uploading documents