Table 8.2 the Agricultural Extension Agent's Office Has Tracked Fertilizer Application and Application
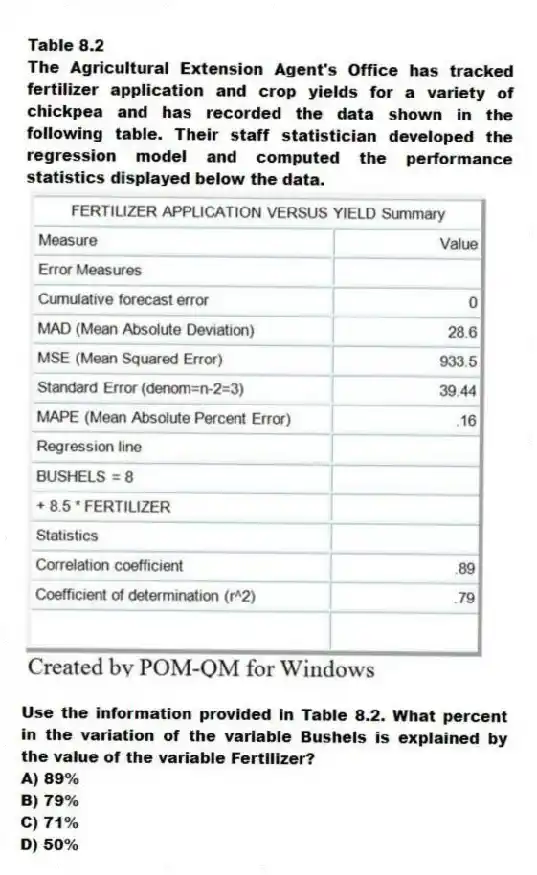
Table 8.2
The Agricultural Extension Agent's Office has tracked fertilizer application and crop yields for a variety of chickpea and has recorded the data shown in the following table. Their staff statistician developed the regression model and computed the performance statistics displayed below the data.
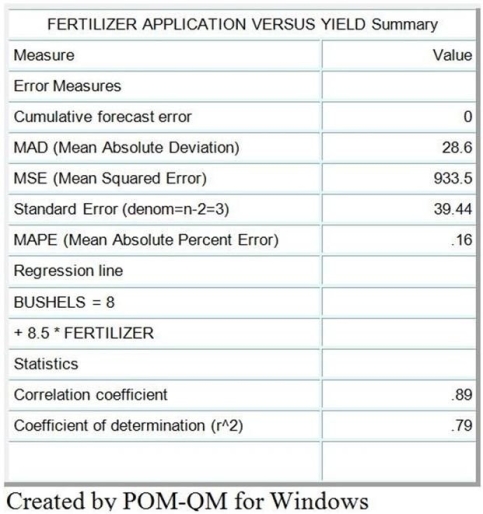
-Use the information provided in Table 8.2. What percent in the variation of the variable Bushels is explained by the value of the variable Fertilizer?
A) 89%
B) 79%
C) 71%
D) 50%
Correct Answer:
Verified
Q72: Table 8.2
The Agricultural Extension Agent's Office has
Q73: Table 8.4
The Furniture Super Mart is a
Q74: Table 8.3
A textbook publisher for books used
Q75: Table 8.4
The Furniture Super Mart is a
Q76: The number of #2 pencils the bookstore
Q78: Table 8.4
The Furniture Super Mart is a
Q79: The causal method of forecasting uses historical
Q80: Table 8.2
The Agricultural Extension Agent's Office has
Q81: A naive forecast is a time-series method
Q82: Table 8.5
![]()
Unlock this Answer For Free Now!
View this answer and more for free by performing one of the following actions

Scan the QR code to install the App and get 2 free unlocks

Unlock quizzes for free by uploading documents