Table 8.3
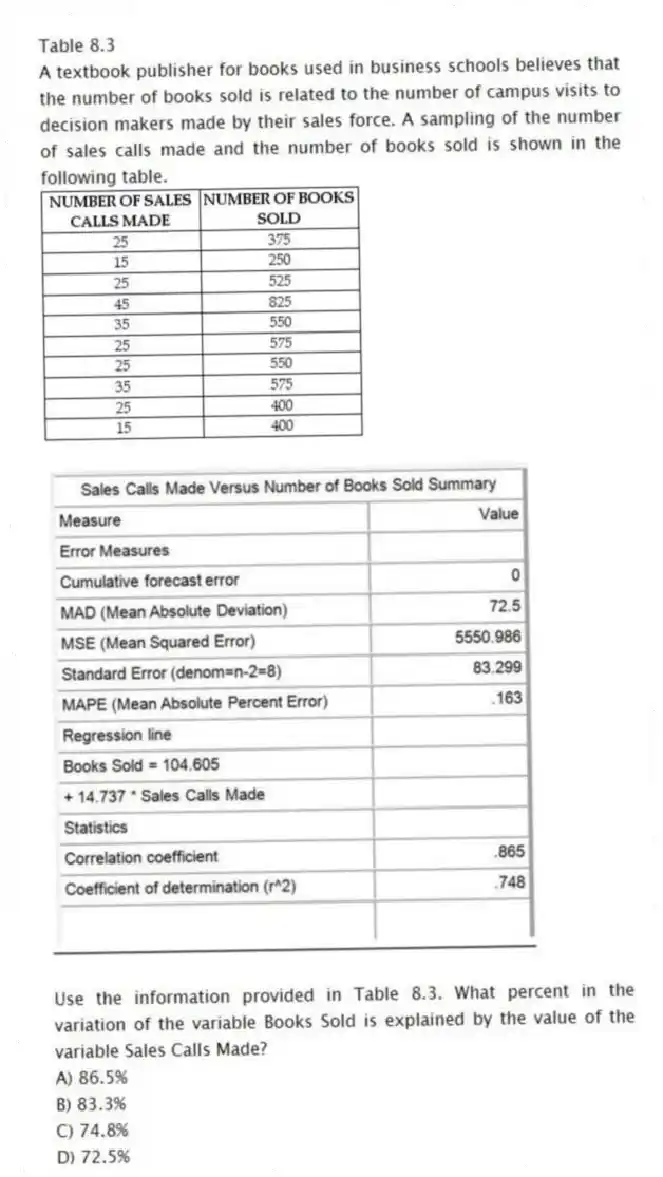
A textbook publisher for books used in business schools believes that the number of books sold is related to the number of campus visits to decision makers made by their sales force. A sampling of the number of sales calls made and the number of books sold is shown in the following table.
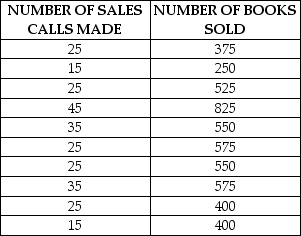
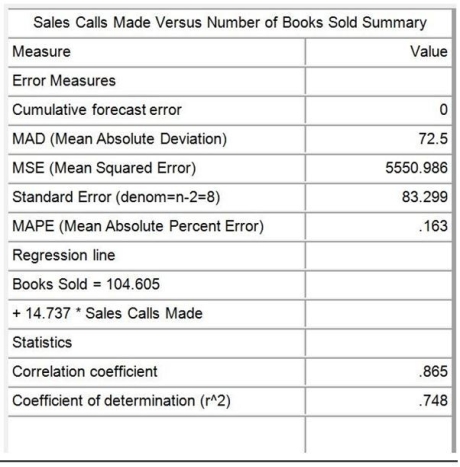
-Use the information provided in Table 8.3. What percent in the variation of the variable Books Sold is explained by the value of the variable Sales Calls Made?
A) 86.5%
B) 83.3%
C) 74.8%
D) 72.5%
Correct Answer:
Verified
Q63: The closer the value of the sample
Q64: Table 8.3
A textbook publisher for books used
Q65: A linear regression model results in the
Q66: Table 8.2
The Agricultural Extension Agent's Office has
Q67: Table 8.4
The Furniture Super Mart is a
Q69: Which one of the following is an
Q70: Table 8.3
A textbook publisher for books used
Q71: Table 8.2
The Agricultural Extension Agent's Office has
Q72: Table 8.2
The Agricultural Extension Agent's Office has
Q73: Table 8.4
The Furniture Super Mart is a
Unlock this Answer For Free Now!
View this answer and more for free by performing one of the following actions

Scan the QR code to install the App and get 2 free unlocks

Unlock quizzes for free by uploading documents