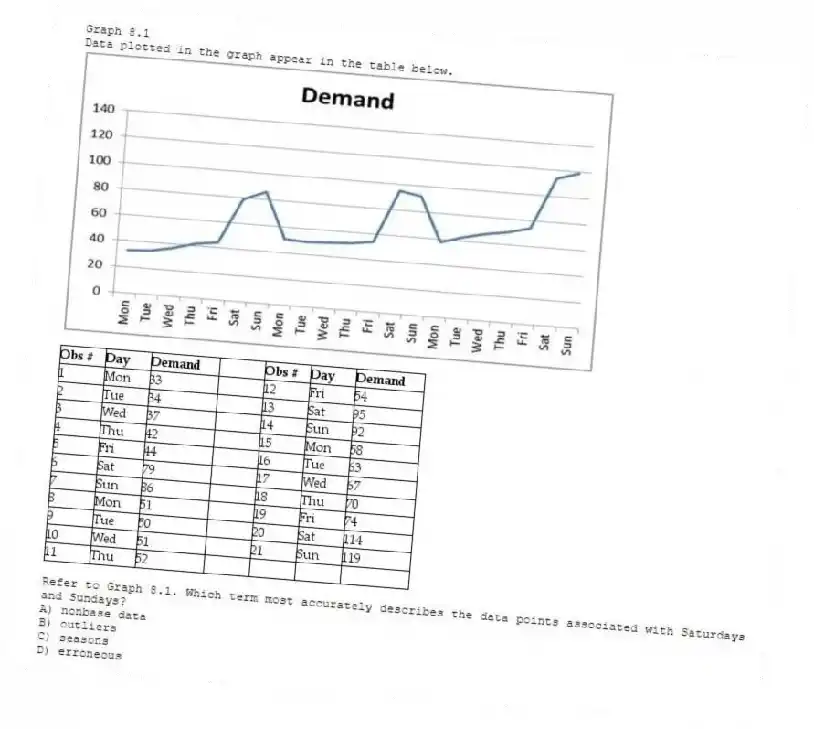
Graph 8.1
Data plotted in the graph appear in the table below.


-Refer to Graph 8.1. Which term most accurately describes the data points associated with Saturdays and Sundays?
A) nonbase data
B) outliers
C) seasons
D) erroneous
Correct Answer:
Verified
Q109: Table 8.6 Q110: Table 8.7 Q111: Table 8.9 Q112: Table 8.7 Q113: In an exponential smoothing model a _ Q115: Graph 8.1 Q116: Table 8.7
![]()
A sales manager wants to forecast
Consider the following results from the
A sales manager wants to forecast
Data plotted in the graph appear
A sales manager wants to forecast
Unlock this Answer For Free Now!
View this answer and more for free by performing one of the following actions

Scan the QR code to install the App and get 2 free unlocks

Unlock quizzes for free by uploading documents