A neighborhood ice cream vendor would like to see if there is a relationship between day of the week and the number of children buying ice cream from her. The following data represent the number of children buying ice cream on each of the seven days of a particular week: 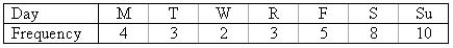
a. Construct a line chart to describe the data.
b. Is there any apparent trend in the data?
________________________________________________________
Correct Answer:
Verified
View Answer
Unlock this answer now
Get Access to more Verified Answers free of charge
Q40: In general, incomes of employees in large
Q41: A high school volleyball coach has summarized
Q42: A variable is a characteristic that changes
Q43: A histogram is usually used to display
Q44: Statistical inference is the process of making
Q46: The following data represents the number of
Q47: The owner of an Italian restaurant would
Q48: The stem-and-leaf plot is used to display
Q49: A bar chart is used to display
Q50: A limnologist is studying a Minnesota lake
Unlock this Answer For Free Now!
View this answer and more for free by performing one of the following actions

Scan the QR code to install the App and get 2 free unlocks

Unlock quizzes for free by uploading documents