Figure: Cold Drinks Sold and Temperature
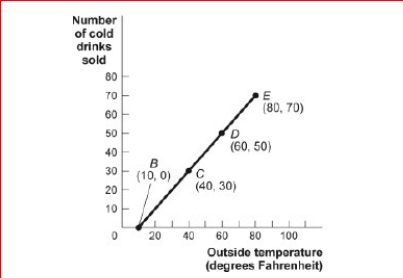
 (Figure: Cold Drinks Sold and Temperature) Look at the figure Cold Drinks Sold and Temperature.If we move from point B to point C in the figure, the outside temperature has
________ and the number of cold drinks sold has _.
A.decreased by 30 degrees; decreased by 30 drinks
B.increased by 20 degrees; increased by 20 drinks
C.increased by 30 degrees; increased by 30 drinks
D.increased by 40 degrees; increased by 40 drinks
Correct Answer:
Verified
View Answer
Unlock this answer now
Get Access to more Verified Answers free of charge
Q2: The relation between two variables that move
Q5: Figure: Good X and Good Y
Q6: Figure: Cold Drinks Sold and Temperature
Q8: On a graph representing two variables:
A)a positive
Q11: The _ of a curve shows the
Q13: Figure: Good X and Good Y
Q14: (Table: Hours Studied and Quiz Score) Look
Q15: Figure: Demand and Supply of Shirts
Q18: The point at which the axes of
Q20: If two variables are negatively related, they
Unlock this Answer For Free Now!
View this answer and more for free by performing one of the following actions

Scan the QR code to install the App and get 2 free unlocks

Unlock quizzes for free by uploading documents