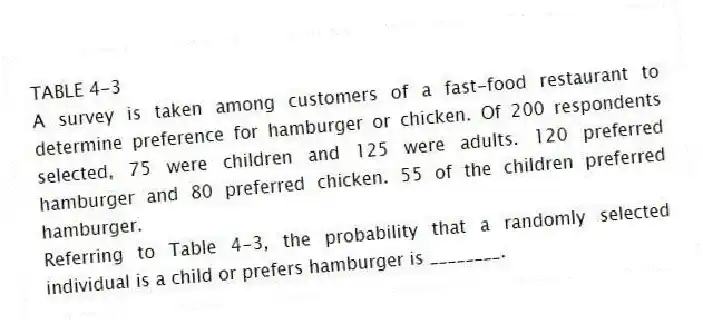
TABLE 4-3
A survey is taken among customers of a fast-food restaurant to determine preference for hamburger or chicken. Of 200 respondents selected, 75 were children and 125 were adults. 120 preferred hamburger and 80 preferred chicken. 55 of the children preferred hamburger.
-Referring to Table 4-3, the probability that a randomly selected individual is a child or prefers hamburger is ________.
Correct Answer:
Verified
Q94: TABLE 4-3
A survey is taken among customers
Q95: TABLE 4-4
Suppose that patrons of a restaurant
Q96: TABLE 4-4
Suppose that patrons of a restaurant
Q97: TABLE 4-4
Suppose that patrons of a restaurant
Q98: TABLE 4-4
Suppose that patrons of a restaurant
Q100: TABLE 4-5
In a meat packaging plant, Machine
Q102: TABLE 4-6
At a Texas college, 60% of
Q143: At the International Pancakes Hut,there are 4
Q144: There are 47 contestants at a national
Q155: Four freshmen are to be assigned to
Unlock this Answer For Free Now!
View this answer and more for free by performing one of the following actions

Scan the QR code to install the App and get 2 free unlocks

Unlock quizzes for free by uploading documents