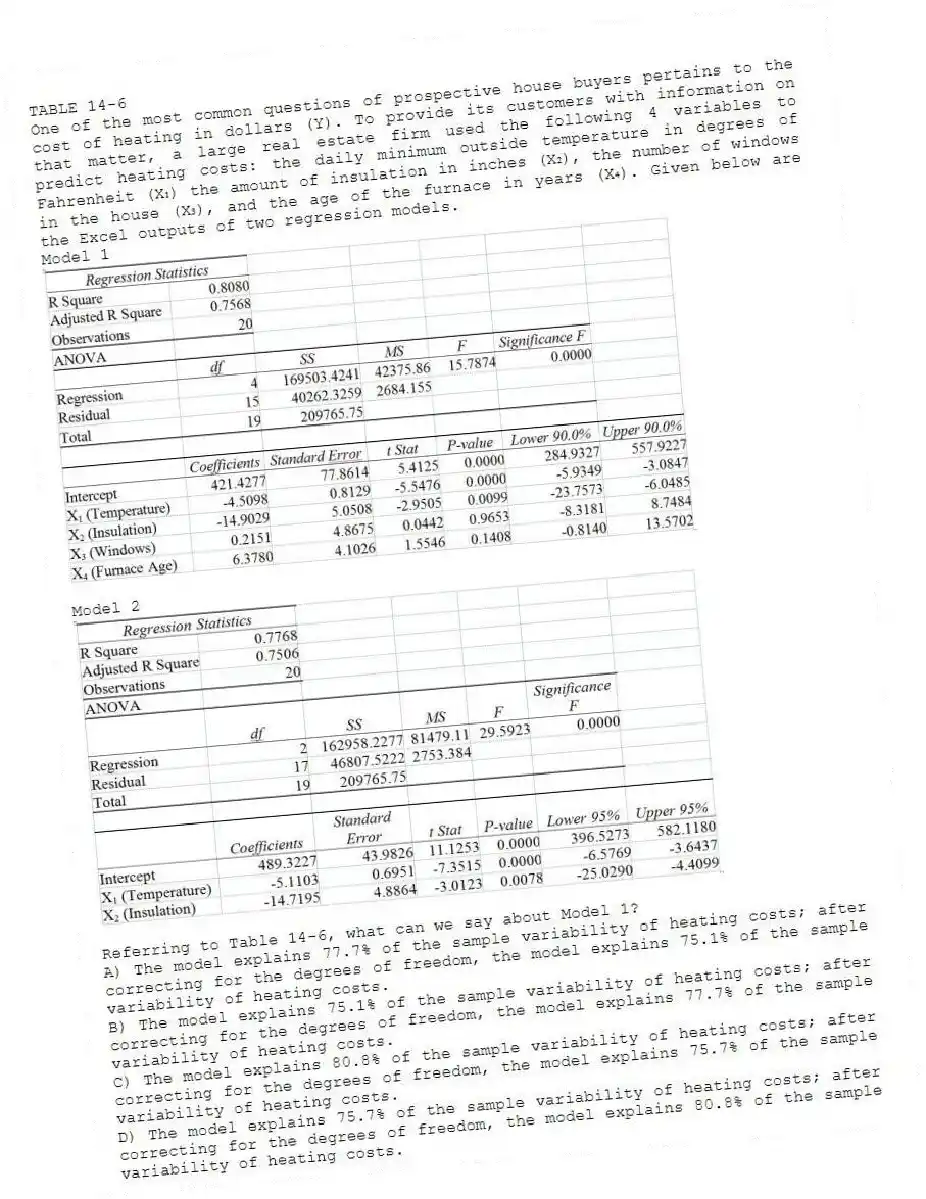
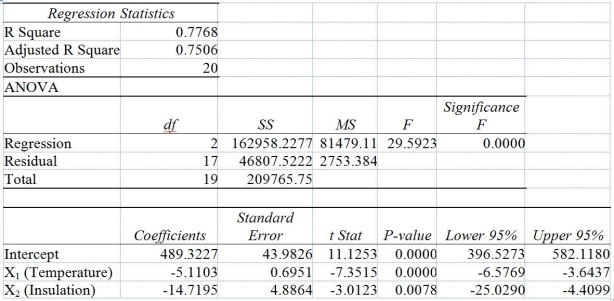
TABLE 14-6
One of the most common questions of prospective house buyers pertains to the cost of heating in dollars (Y) . To provide its customers with information on that matter, a large real estate firm used the following 4 variables to predict heating costs: the daily minimum outside temperature in degrees of Fahrenheit (X₁) the amount of insulation in inches (X₂) , the number of windows in the house (X₃) , and the age of the furnace in years (X₄) . Given below are the Excel outputs of two regression models.
Model 1
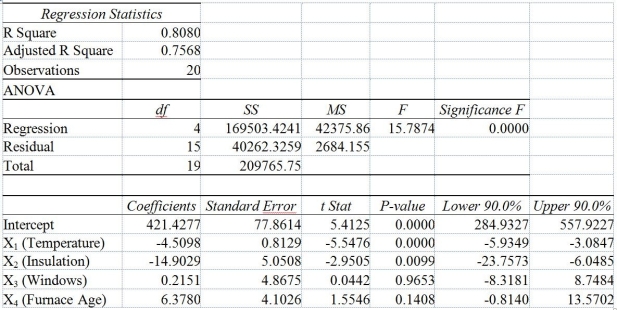
Model 2
-Referring to Table 14-6, what can we say about Model 1?
A) The model explains 77.7% of the sample variability of heating costs; after correcting for the degrees of freedom, the model explains 75.1% of the sample variability of heating costs.
B) The model explains 75.1% of the sample variability of heating costs; after correcting for the degrees of freedom, the model explains 77.7% of the sample variability of heating costs.
C) The model explains 80.8% of the sample variability of heating costs; after correcting for the degrees of freedom, the model explains 75.7% of the sample variability of heating costs.
D) The model explains 75.7% of the sample variability of heating costs; after correcting for the degrees of freedom, the model explains 80.8% of the sample variability of heating costs.
Correct Answer:
Verified
Q64: TABLE 14-6
One of the most common questions
Q65: TABLE 14-5
A microeconomist wants to determine how
Q66: TABLE 14-5
A microeconomist wants to determine how
Q67: TABLE 14-5
A microeconomist wants to determine how
Q68: In calculating the standard error of the
Q70: TABLE 14-6
One of the most common questions
Q73: TABLE 14-6
One of the most common questions
Q74: When an additional explanatory variable is introduced
Q89: When an additional explanatory variable is introduced
Q94: When an explanatory variable is dropped from
Unlock this Answer For Free Now!
View this answer and more for free by performing one of the following actions

Scan the QR code to install the App and get 2 free unlocks

Unlock quizzes for free by uploading documents