Flagg and Rossi own a fleet of four limos.The current odometer readings for the four limos are shown in the table below:  Suppose you were to take all possible simple random samples of size 2 that could be selected from this limo population and calculated the sample mean odometer reading for each sample.Which one of the following graphs shows the sampling distribution of the sample mean?
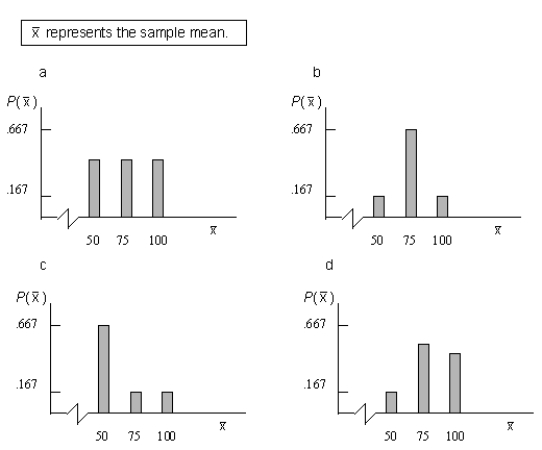
A) Graph a
B) Graph b
C) Graph c
D) Graph d
E) none of the above
Correct Answer:
Verified
Q93: The average annual health care cost in
Q94: The table below shows the names of
Q95: The average annual health care cost in
Q96: The list below shows the five stocks
Q97: The number of job offers received by
Q99: Crawford Retailing has 6 sales reps, designated
Q100: The table below shows the names of
Q101: Chen Inc.wants to estimate the average processing
Q102: The National Center for Health Statistics reports
Q103: You want to estimate the average GMAT
Unlock this Answer For Free Now!
View this answer and more for free by performing one of the following actions

Scan the QR code to install the App and get 2 free unlocks

Unlock quizzes for free by uploading documents