The following chart gives the number of full years served by the first 42 presidents of the United States (up to and including George W.Bush) .What is the standard deviation of full years served by the first 42 presidents of the United States? Remember that this includes all of the presidents. 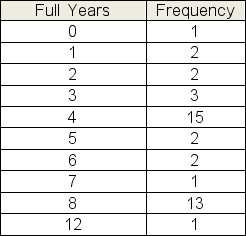
A) 2.0 years
B) 4.0 years
C) 5.2 years
D) 6.5 years
E) 8.3 years
Correct Answer:
Verified
Q104: Purchasing agent Angela Rodriguez reported the number
Q105: Over the past month, Kim recorded the
Q106: Atlantic Power and Light tracked daily power
Q107: Turcott Roof and Deck has 130 jobs
Q108: Turcott Roof and Deck has 130 jobs
Q110: Turcott Roof and Deck has 130 jobs
Q111: The number of auditors required for 200
Q112: The following chart gives the number of
Q113: In a recent survey, 75 college students
Q114: Atlantic Power and Light tracked daily power
Unlock this Answer For Free Now!
View this answer and more for free by performing one of the following actions

Scan the QR code to install the App and get 2 free unlocks

Unlock quizzes for free by uploading documents