The graph shown demonstrates the domestic demand and supply for a good, as well as a quota and the world price for that good. 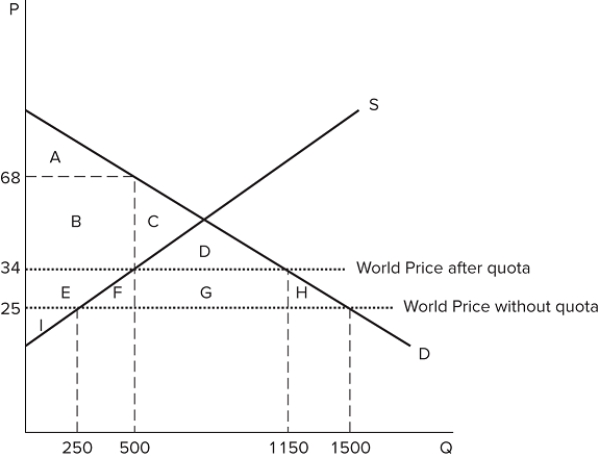 The government of this economy can restrict trade by imposing a quota of:
A) 350 units.
B) 900 units.
C) 1,150 units.
D) 1,500 units.
Correct Answer:
Verified
Q123: Profits earned by foreign firms or governments
Q124: As a general rule, free trade:
A)acts to
Q125: The graph shown demonstrates the domestic demand
Q126: As a general rule, free trade:
A)increases the
Q127: The graph shown demonstrates the domestic demand
Q129: The graph shown demonstrates the domestic demand
Q130: The graph shown demonstrates the domestic demand
Q131: The graph shown demonstrates the domestic demand
Q132: In general, one of the results of
Q133: The graph shown demonstrates the domestic demand
Unlock this Answer For Free Now!
View this answer and more for free by performing one of the following actions

Scan the QR code to install the App and get 2 free unlocks

Unlock quizzes for free by uploading documents