The graph shown displays the cost curves for a firm in a perfectly competitive market. Assume that all firms in this market have identical cost structures. Initially the market price is $8. Which of the following statements is true? 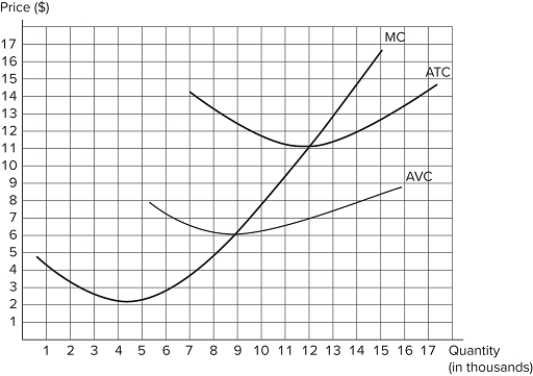
A) The long run equilibrium price will be $6.
B) Market demand will decrease in the long run.
C) The long run equilibrium price will be $11.
D) Market supply will increase in the long run.
Correct Answer:
Verified
Q105: In the long run in a perfectly
Q106: <p><b><b><span style="font-size:20pt;"><span style="color:#FF0000;"> Q107: The graph shown displays the cost curves Q108: The graph shown displays the cost curves Q109: The key difference between supply in the Q111: If a firm in a perfectly competitive Q112: In the long run, firms will enter Q113: If a firm in a perfectly competitive Q114: The graph shown displays the cost curves Q115: In the short run in a perfectly![]()
Unlock this Answer For Free Now!
View this answer and more for free by performing one of the following actions

Scan the QR code to install the App and get 2 free unlocks

Unlock quizzes for free by uploading documents