The graph shown represents the cost and revenue curves of a firm in a perfectly competitive market. 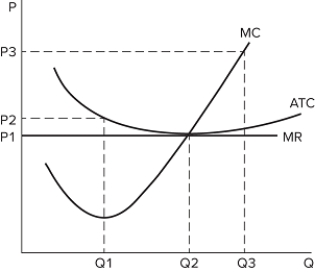 If the firm is producing at Q3:
A) profits are being maximized.
B) average total costs exceed the market price.
C) it should increase production.
D) marginal revenue is greater than marginal cost.
Correct Answer:
Verified
Q151: If demand increases in a perfectly competitive
Q152: In reality, the long run supply curve
Q153: In theory, which of the following characterizes
Q154: The graph shown represents the cost and
Q155: If demand increases in a perfectly competitive
Q157: In a perfectly competitive market, when the
Q158: If demand increases in a perfectly competitive
Q159: The graph shown represents the cost and
Q160: The graph shown represents the cost and
Q161: When demand increases in a perfectly competitive
Unlock this Answer For Free Now!
View this answer and more for free by performing one of the following actions

Scan the QR code to install the App and get 2 free unlocks

Unlock quizzes for free by uploading documents