Multiple Choice
The least squares regression line for the points shown in the graph is  . Calculate S, the sum of the squared errors.
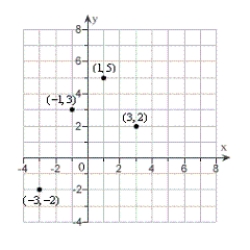
A) 
B) 
C) 
D) 
E) 
Correct Answer:
Verified
Related Questions
The least squares regression line for the points shown in the graph is . Calculate S, the sum of the squared errors.
A)
B)
C)
D)
E)
Correct Answer:
Verified


