Figure 6-9 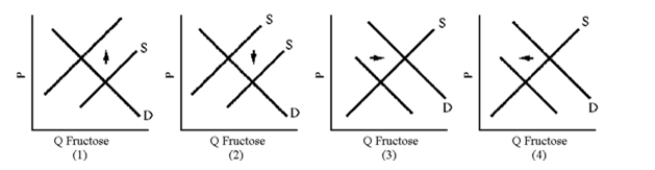
-In 1983, government price supports raised the price of sugar above its equilibrium value.Which graph in Figure 6-9 illustrates the impact of sugar price supports on the sugar substitute fructose?
A) 1
B) 2
C) 3
D) 4
Correct Answer:
Verified
Q187: In 1975, New York City increased regulated
Q188: The demand for a new effective drug
Q189: If two goods are complements, their cross
Q190: Which of the following goods will have
Q191: Which of the following goods will have
Q193: The price elasticity of new automobile purchases
Q194: The measure used to determine whether two
Q195: Certain goods are related such that an
Q196: The relationship between a change in consumer
Q197: A relatively large increase in the cost
Unlock this Answer For Free Now!
View this answer and more for free by performing one of the following actions

Scan the QR code to install the App and get 2 free unlocks

Unlock quizzes for free by uploading documents