Multiple Choice
Figure 7-8
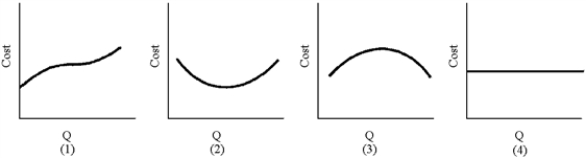
-Of the graphs in Figure 7-8, which resembles marginal cost?
A) 1
B) 2
C) 3
D) 4
Correct Answer:
Verified
Related Questions
Q151: Figure 7-8 Q153: Average cost curves decline because Q165: Figure 7-7 Q168: Figure 7-10 Q172: Figure 7-8 Q174: Figure 7-10 Q183: In the typical AC curve, the downward-sloping Q185: Which of the following formulas defines average Q191: Figure 7-11 Q198: A firm's AC will eventually begin to Unlock this Answer For Free Now! View this answer and more for free by performing one of the following actions Scan the QR code to install the App and get 2 free unlocks Unlock quizzes for free by uploading documents
![]()
A)fixed cost is![]()
![]()
![]()
![]()
![]()

