Figure 7-14 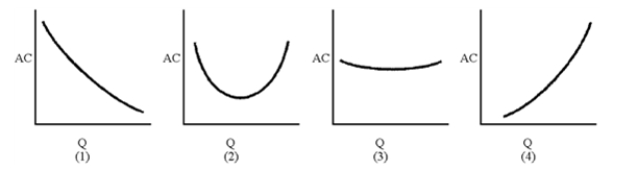
-Of the long-run AC curves in Figure 7-14, which displays increasing returns to scale for all levels of output?
A) 1
B) 2
C) 3
D) 4
Correct Answer:
Verified
Q111: If doubling the quantity of inputs more
Q202: If in some production range average cost
Q203: If a firm increases inputs by 15
Q204: When economies of scale exist,
A)production costs per
Q205: Whether or not a production process shows
Q206: Economies of scale
A)require inputs' MPP to fall
Q208: Constant returns to scale for a firm
Q210: When economies of scale are present,
A)costs per
Q211: If economies of scale exist for a
Q212: If in some range of production, average
Unlock this Answer For Free Now!
View this answer and more for free by performing one of the following actions

Scan the QR code to install the App and get 2 free unlocks

Unlock quizzes for free by uploading documents