Multiple Choice
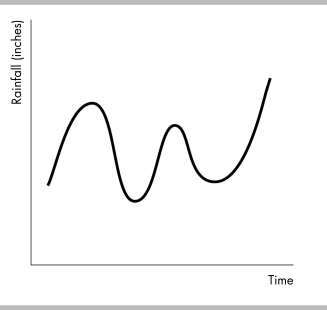
-The figure above shows a
A) two-variable time-series graph.
B) time-series graph.
C) scatter diagram.
D) regression.
Correct Answer:
Verified
Related Questions
Q363: Q364: A time-series graph reveals whether there is Q365: Inflation climbed steadily from 1952 to 1972. Q366: Which of the following is CORRECT about Q367: Q369: A trend is Q370: Q371: A trend shows Q372: The horizontal axis on a time-series graph Q373: Unlock this Answer For Free Now! View this answer and more for free by performing one of the following actions Scan the QR code to install the App and get 2 free unlocks Unlock quizzes for free by uploading documents![]()
![]()
A) a measure of closeness![]()
A) the degree of correlation
A)![]()

