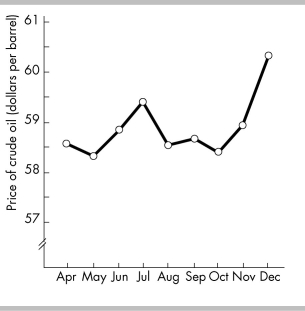
-Using the above figure, during which month was the price for crude oil the highest?
A) July
B) December
C) May
D) October
Correct Answer:
Verified
Q375: A time-series graph displays the price of
Q376: Q377: Trend refers to Q378: To see how variables evolve over time Q379: Which type of graph is used to Q381: Real GDP in 2017 is $10 trillion. Q382: The chain-weighted output index method of measuring Q383: The chain-weighted output index method Q384: A graph shows the wages of factory Q385: A trend is a general tendency for![]()
A) the scale used on
A) is used
Unlock this Answer For Free Now!
View this answer and more for free by performing one of the following actions

Scan the QR code to install the App and get 2 free unlocks

Unlock quizzes for free by uploading documents