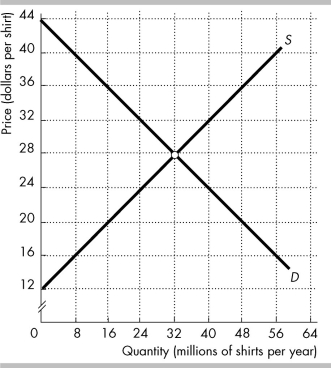
 The figure shows the market for shirts in the United States, where D is the domestic demand curve and S is the domestic supply curve. The world price is $20 per shirt. The United States imposes a tariff on imported shirts of $4 per shirt.
-In the figure above, with the tariff Americans buy ________ million shirts per year.
A) 40
B) 48
C) 32
D) 16
Correct Answer:
Verified
Q60: In 2013 the United States was considering
Q61: Since the 1930s, tariff levels in the
Q62: During the Great Depression in the 1930s,
Q63: U.S. tariffs peaked in
A) 1992.
B) 1961.
C) 1940.
D)
Q64: A tariff is imposed on a good.
Q66: An import quota is
A) a tariff that
Q67: The Smoot-Hawley Act
A) made most tariffs illegal.
B)
Q68: Average tariff levels in the United States
Unlock this Answer For Free Now!
View this answer and more for free by performing one of the following actions

Scan the QR code to install the App and get 2 free unlocks

Unlock quizzes for free by uploading documents