Multiple Choice
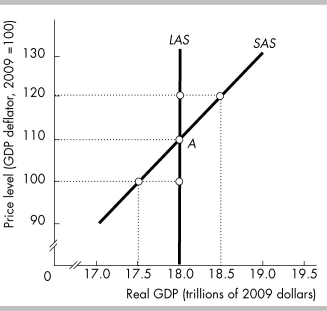
-In the figure above, potential GDP equals
A) $17.5 trillion.
B) $18.0 trillion.
C) $18.5 trillion.
D) None of the above answers is correct.
Correct Answer:
Verified
Related Questions
Q36: The short-run aggregate supply curve
A) is vertical.
B)
Q37: Q38: Q39: The short-run aggregate supply curve Q40: Moving along the short-run aggregate supply curve,![]()
![]()
A) is vertical.
B)
A)

