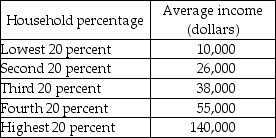
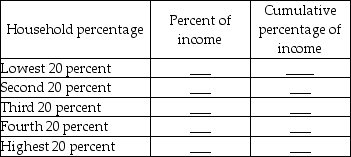
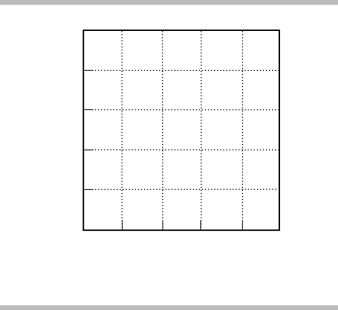
-The first table above gives the average income received by each 20 percent group of households. Complete the second table. Label the axes above and then plot the Lorenz curve.
Correct Answer:
Verified
View Answer
Unlock this answer now
Get Access to more Verified Answers free of charge
Q317: "Over the past two decades, the distribution
Q318: What are the three ways that the
Q319: How has income inequality changed in recent
Q320: With respect to income redistribution programs, what
Q321: An increase in income equality causes the
Q323: If one person has all the income
Q324: In the United States, measured wealth is
Unlock this Answer For Free Now!
View this answer and more for free by performing one of the following actions

Scan the QR code to install the App and get 2 free unlocks

Unlock quizzes for free by uploading documents