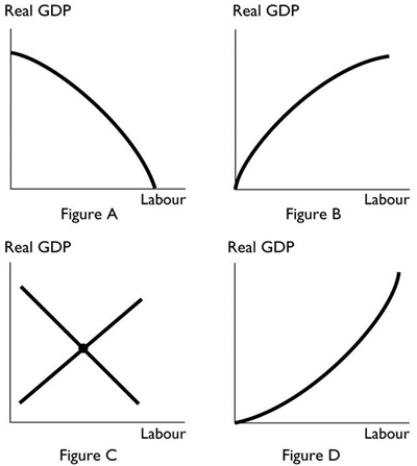
-The figure above that most accurately shows a production function is
A) Figure A.
B) Figure B.
C) Figure C.
D) Figure D.
E) Both Figure A and Figure B; Figure A for an economy with an excess of labour and Figure B for an economy with a shortage of labour.
Correct Answer:
Verified
Q33: The supply of labour is defined as
Q34: When the labour market is in equilibrium,
A)
Q35: The effect of an increase in population
Q36: The factors of production that produce real
Q37: The production function displays
A) increasing returns.
B) diminishing
Q39: As additional units of labour hours are
Q40: For a household, the opportunity cost of
Q41: One possible way of achieving faster economic
Q42: According to the new growth theory, which
Q43: Human capital is defined as the
A) accumulated
Unlock this Answer For Free Now!
View this answer and more for free by performing one of the following actions

Scan the QR code to install the App and get 2 free unlocks

Unlock quizzes for free by uploading documents