The line graph shows the costs of a 30-second television spot (in thousands of dollars) during the Super Bowl from 1995 to 2005. 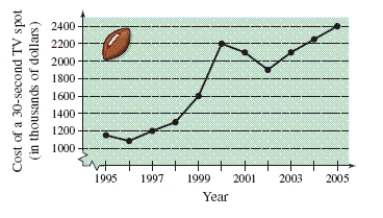 Estimate the increase in the cost of a 30-second spot from the Super Bowl in 2000 to the Super Bowl in 2005.
A) 300 thousand dollars
B) 200 thousand dollars
C) 100 thousand dollars
D) 400 thousand dollars
E) 360 thousand dollars
Correct Answer:
Verified
Q17: Identify the rule of algebra illustrated by
Q18: Identify the degree and leading coefficient of
Q19: Factor the trinomial. Q20: Use absolute value notation to describe the Q21: Evaluate the expression. Q23: Evaluate the expression without using a calculator. Q24: Simplify the expression. Q25: Evaluate the expression. Q26: Factor the expression by removing the common Q27: The double bar graph below shows the Unlock this Answer For Free Now! View this answer and more for free by performing one of the following actions Scan the QR code to install the App and get 2 free unlocks Unlock quizzes for free by uploading documents![]()
![]()
![]()
![]()

