The line graph shows the costs of a 30-second television spot (in thousands of dollars) during the Super Bowl from 1995 to 2005. 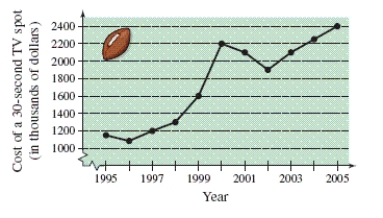 Estimate the increase in the cost of a 30-second spot from the Super Bowl in 1998 to the Super Bowl in 2005.
A) 550 thousand dollars
B) 2200 thousand dollars
C) 1650 thousand dollars
D) 1980 thousand dollars
E) 1100 thousand dollars
Correct Answer:
Verified
Q58: Approximate the numbers and place the correct
Q59: Evaluate the expression. Q60: Place the correct symbol (<, >, or Q61: Determine which numbers in the set are Q64: Identify the degree and leading coefficient of Q66: Perform the subtraction and simplify. Q67: Completely factor the expression. Q68: Simplify the complex fraction. Q71: Use inequality notation to describe the Q73: Is the interval bounded or unbounded? -7 Unlock this Answer For Free Now! View this answer and more for free by performing one of the following actions Scan the QR code to install the App and get 2 free unlocks Unlock quizzes for free by uploading documents![]()

![]()
![]()

