Multiple Choice
A graph of 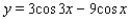 for
for  is shown in the figure. Find the exact values of the x-intercepts.
A) 
B) 
C) 
D) 
E) 
Correct Answer:
Verified
Related Questions
Q43: Verify the identity. Q44: Express as a cofunction of a complementary Q45: Shown in the figure is a graph Unlock this Answer For Free Now! View this answer and more for free by performing one of the following actions Scan the QR code to install the App and get 2 free unlocks Unlock quizzes for free by uploading documents![]()

