The question refers to the table, which compares the percent sequence homology of four different parts of a gene (two introns and two exons) that is found in five different eukaryotic species. The data show the percentage of sequence homology of each intron and exon in comparison to the sequences in species A.
% Sequence Homology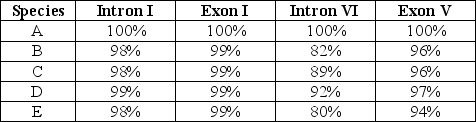
Based on the data in the table, which phylogenetic tree is the most likely depiction of the evolutionary relationships among these five species?
A) 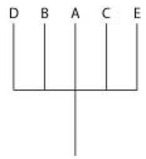
B) 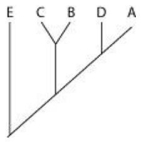
C) 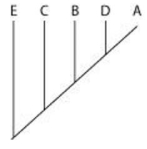
D) 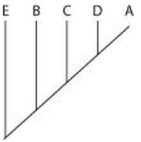
Correct Answer:
Verified
Q22: Which of the following taxa are problematic
Q23: The figure represents a phylogenetic tree of
Q24: The figure represents a phylogenetic tree of
Q25: Which statement represents the best explanation for
Q26: Which of the following statements best describes
Q28: The question refers to the table, which
Q29: Which of the following statements correctly describes
Q30: For which of the following organisms would
Q31: Use the figure to answer the following
Q32: In the table, a Y indicates that
Unlock this Answer For Free Now!
View this answer and more for free by performing one of the following actions

Scan the QR code to install the App and get 2 free unlocks

Unlock quizzes for free by uploading documents