The line graph shows the costs of a 30-second television spot (in thousands of dollars) during the Super Bowl from 1995 to 2005. 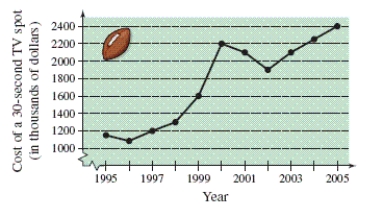 Estimate the increase in the cost of a 30-second spot from the Super Bowl in 1998 to the Super Bowl in 2002.
A) 1080 thousand dollars
B) 1200 thousand dollars
C) 300 thousand dollars
D) 900 thousand dollars
E) 600 thousand dollars
Correct Answer:
Verified
Q46: Evaluate the expression. Q47: List the coefficients of the variable terms Q48: Evaluate the expression. Q49: Approximate the numbers and place the correct Q50: Perform the division and simplify. Q52: The double bar graph below shows the Q53: Completely factor the expression. Q54: Determine which numbers in the set are Q55: Place the correct symbol (<, >, or Q56: Use inequality notation to describe the Unlock this Answer For Free Now! View this answer and more for free by performing one of the following actions Scan the QR code to install the App and get 2 free unlocks Unlock quizzes for free by uploading documents![]()
![]()

![]()

