Multiple Choice
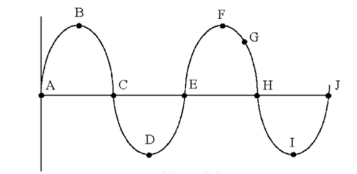
-Which one of the following represents the value at point G in Figure 8-1?
A) the period
B) the peakVoltage
C) the frequency
D) the RMSVoltage
Correct Answer:
Verified
Related Questions
Q9: One complete sine wave contains 360°
Q10: The term RMS stands for ʺroot-mean-square.ʺ
Q11: Current flows both ways simultaneously in an
Q12: Q13: A sineW aveʹs peak value is smaller Q15: Commercial line voltages are usually square waves Q16: Rise time, fall time, and duty cycle Q17: 20 Vrms of alternating currentW ill illuminate![]()
Unlock this Answer For Free Now!
View this answer and more for free by performing one of the following actions

Scan the QR code to install the App and get 2 free unlocks

Unlock quizzes for free by uploading documents