Figure 8-1
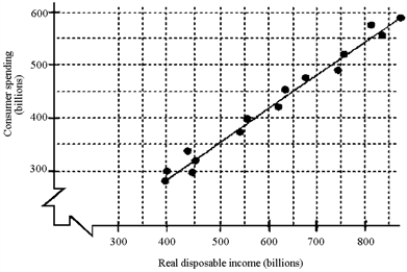
-The slope of the fitted line that shows the relationship between consumer spending and disposable income is the
A) marginal propensity to save.
B) probability of expending.
C) marginal income spend.
D) marginal propensity to consume.
Correct Answer:
Verified
Q99: The marginal propensity to consume (MPC) is
Q100: If disposable income increases by $400 billion
Q101: A movement upward along the consumption function
Q102: For each $1 of a tax cut,
Q103: A movement along the consumption function can
Q105: To predict the effects of a tax
Unlock this Answer For Free Now!
View this answer and more for free by performing one of the following actions

Scan the QR code to install the App and get 2 free unlocks

Unlock quizzes for free by uploading documents