Multiple Choice
Figure 7-9 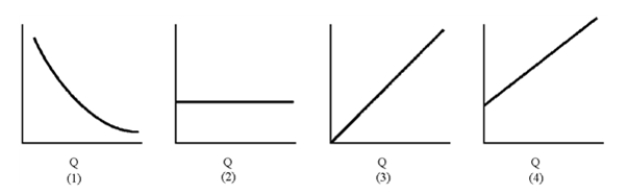
-Of the graphs in Figure 7-9, which represents total fixed cost?
A) 1
B) 2
C) 3
D) 4
Correct Answer:
Verified
Related Questions
Figure 7-9
-Of the graphs in Figure 7-9, which represents total fixed cost?
A) 1
B) 2
C) 3
D) 4
Correct Answer:
Verified

