TABLE 11-12
Parents complain that children read too few storybooks and watch too much television nowadays. A survey of 1,000 children reveals the following information on average time spent watching TV and average time spent reading storybooks.
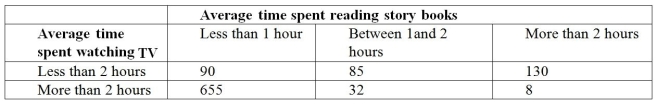
-Referring to Table 11-12, we want to test whether there is any relationship between average time spent watching TV and average time spent reading storybooks. Suppose the value of the test statistic was 164 (which is not the correct answer) and the critical value was 19.00 (which is not the correct answer) . Then we could conclude that
A) there is a connection between time spent reading storybooks and time spent watching TV.
B) there is no connection between time spent reading storybooks and time spent watching TV.
C) more time spent reading storybooks leads to less time spent watching TV.
D) more time spent watching TV leads to less time spent reading storybooks.
Correct Answer:
Verified
Q85: TABLE 11-11
The director of admissions at a
Q86: TABLE 11-11
The director of admissions at a
Q87: TABLE 11-12
Parents complain that children read too
Q88: TABLE 11-11
The director of admissions at a
Q89: TABLE 11-11
The director of admissions at a
Q91: TABLE 11-12
Parents complain that children read too
Q92: TABLE 11-11
The director of admissions at a
Q93: TABLE 11-13
Recent studies have found that American
Q94: TABLE 11-12
Parents complain that children read too
Q110: The chi-square test of independence requires that
Unlock this Answer For Free Now!
View this answer and more for free by performing one of the following actions

Scan the QR code to install the App and get 2 free unlocks

Unlock quizzes for free by uploading documents