A researcher wants to explore the relationship between cricket chirps and temperature.The following scatterplot shows data collected over a random sample of 8 days.Each day, the temperature was recorded, as well as the number of times a cricket chirped in 15 seconds.According to this scatterplot, what can be said (if anything) about the relationship between cricket chirps and temperature? 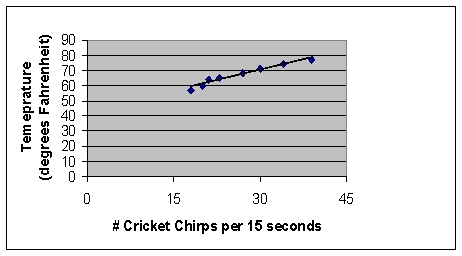
A) There appears to be a strong positive linear relationship.
B) There appears to be a weak linear relationship because the slope of the line is fairly flat.
C) There can't be a relationship; cricket chirps can't be related to temperature.
D) None of the above.
Correct Answer:
Verified
Q25: For Questions , use the following narrative
Narrative:
Q26: For Questions , use the following narrative
Narrative:
Q27: For Questions , use the following narrative
Narrative:
Q28: Which of the following is a correct
Q29: Which of the following describes a 'detrended'
Q30: For Questions , use the following narrative
Narrative:
Q32: For Questions , use the following narrative
Narrative:
Q33: For Questions , use the following narrative
Narrative:
Q34: If there is no linear relationship between
Q35: The _ between two measurement variables is
Unlock this Answer For Free Now!
View this answer and more for free by performing one of the following actions

Scan the QR code to install the App and get 2 free unlocks

Unlock quizzes for free by uploading documents