Multiple Choice
The graph below shows the number of tuberculosis deaths in the United States from 1989 to 1998. 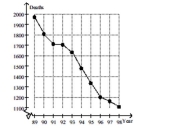 Estimate the average rate of change in tuberculosis deaths from 1993 to 1995.
A) About -150 deaths per year
B) About -300 deaths per year
C) About -1 deaths per year
D) About -80 deaths per year
Correct Answer:
Verified
Related Questions
Q27: Find the limit. Q28: Use the graph to evaluate the Q29: Use the graph to evaluate the Q30: Find the limit. Q31: Use the table to estimate the Unlock this Answer For Free Now! View this answer and more for free by performing one of the following actions Scan the QR code to install the App and get 2 free unlocks Unlock quizzes for free by uploading documents
-
-

