Multiple Choice
The graph shows the depth of water W in a reservoir over a one-year period as a function of the number of days x since the beginning of the year. Estimate the average rate of change of W between x = 0 and x= 100?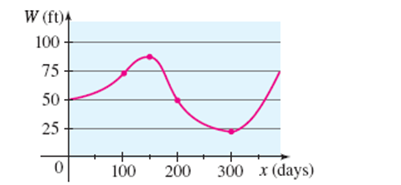
A)
B)
C)
D)
E) none of these
Correct Answer:
Verified
Related Questions
Q89: Suppose the graph of f is
Q90: Use a graphing calculator to determine
Q91: Evaluate Q92: Find the inverse of the function. Q93: For the function Q95: Find the domain of the function. Q96: Determine if the equation
Unlock this Answer For Free Now!
View this answer and more for free by performing one of the following actions

Scan the QR code to install the App and get 2 free unlocks

Unlock quizzes for free by uploading documents