The graph gives the number of farms in the United States from 1850 to 2000.Estimate the average rate of change in the number of farms between the following years.
(i) 1860 and 1890
(ii) 1920 and 1980 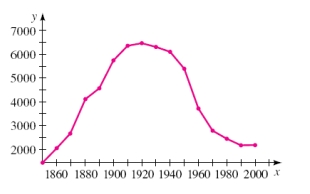
Correct Answer:
Verified
Q103: For the function
Q104: A man is running around a
Q105: Determine whether the function
Q106: Given Q107: Use a graphing calculator to determine Q109: Use a graphing calculator to find, Q110: Use a graphing device to draw Q111: Determine if the equation Q112: Find the inverse of the function. Q113: If
Unlock this Answer For Free Now!
View this answer and more for free by performing one of the following actions

Scan the QR code to install the App and get 2 free unlocks

Unlock quizzes for free by uploading documents