The bar graph below shows the regions in which all the passenger cars were produced during a recent year. What is the difference between the number of passenger cars produced in Western Europe and the number produced in Eastern Europe/Russia? 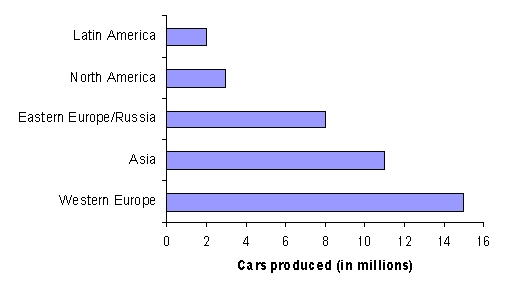
A) 9 million passenger cars
B) 23 million passenger cars
C) 7 million passenger cars
D) 11 million passenger cars
E) 24 million passenger cars
Correct Answer:
Verified
Q19: The pictograph in the following figure gives
Q20: The circle graph shows a breakdown, according
Q21: The broken-line graph below shows the average
Q22: The double-bar graph below shows the fuel
Q23: The bar graph below shows the
Q25: The double-broken-line graph shows the number of
Q26: The double-bar graph below shows the fuel
Q27: A nurse monitors the blood glucose levels
Q28: A nurse monitors the blood glucose levels
Q29: The broken-line graph shows the percent
Unlock this Answer For Free Now!
View this answer and more for free by performing one of the following actions

Scan the QR code to install the App and get 2 free unlocks

Unlock quizzes for free by uploading documents