The frequency polygon in Figure shows the distribution of scores of the approximately 1,548,000 students who took the SAT Math exam in 2010. Use the following figure Approximately how many students scored lower than 700? 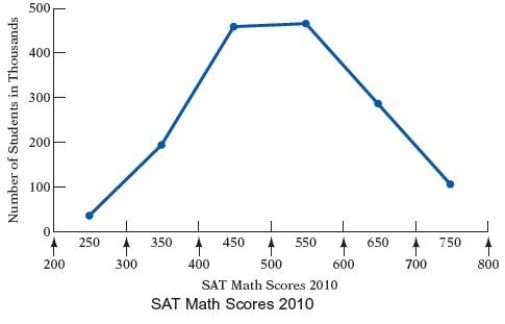
A) Approximately 691,000 students
B) Approximately 689,000 students
C) Approximately 688,500 students
D) Approximately 691,500 students
E) Approximately 690,000 students
Correct Answer:
Verified
Q53: The total cholesterol readings for 40 female
Q54: The frequency polygon below shows the distances
Q55: Most health statistics list normal body temperature
Q56: The total cholesterol readings for 40 female
Q57: The annual tuition for undergraduate college students
Q59: The frequency polygon in Figure shows the
Q60: The number of big-screen televisions sold each
Q61: The life expectancies, in years, in
Q62: Eight health maintenance organizations (HMOs) presented group
Q63: The times, in seconds, for a 100-meter
Unlock this Answer For Free Now!
View this answer and more for free by performing one of the following actions

Scan the QR code to install the App and get 2 free unlocks

Unlock quizzes for free by uploading documents