The box-and-whiskers plot below shows the distribution of median incomes for 50 towns. What is the lowest value in the set of data? The highest value? The first quartile? The third quartile? The median? Find the range and the interquartile range. 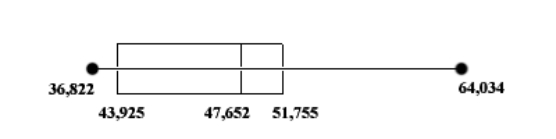
A) Lowest = $36,822; highest = $64,034; Q1 = $51,755; Q3 = $43,925; median = $47,652; range = $27,212; interquartile range = $7830
B) Lowest = $36,822; highest = $64,034; Q1 = $43,925; Q3 = $51,755; median = $47,652; range = $7830; interquartile range = $27,212
C) Lowest = $36,822; highest = $64,034; Q1 = $43,925; Q3 = $51,755; median = $47,652; range = $27,212; interquartile range = $7830
D) Lowest = $36,822; highest = $64,034; Q1 = $51,755; Q3 = $43,925; median = $47,652; range = $7830; interquartile range = $27,212
E) None of the above
Correct Answer:
Verified
Q68: Cymbalta is a prescription medication used
Q69: Of 3981 obese patients who had
Q70: The number of days that 12 patients
Q71: Two dice are rolled.
a. What
Q72: Each of the letters of the
Q74: A dodecahedral die has 12 sides
Q75: A patient's blood sugar readings were recorded
Q76: A consumer research group purchased identical items
Q77: Eight health maintenance organizations (HMOs) presented group
Q78: Three blue marbles, eight green marbles,
Unlock this Answer For Free Now!
View this answer and more for free by performing one of the following actions

Scan the QR code to install the App and get 2 free unlocks

Unlock quizzes for free by uploading documents