The statistics shown in the graph at the below are from the 2007 National Health Interview Survey (NHIS) , an annual in person survey of Americans regarding their health-and illness-related experiences. The Complementary and Alternative Medicine (CAM) section gathered information on 23,393 adults aged 18 and older.(Source: http://nccam.nih.gov /news/camstats/2007/ ) In the United States, according to this survey, approximately 38% of adults are using some form of complementary and alternative medicine. If the adult population of the United States is approximately 208,000,000 people, how may adults are estimated to use some form of complementary and alternative medicine? 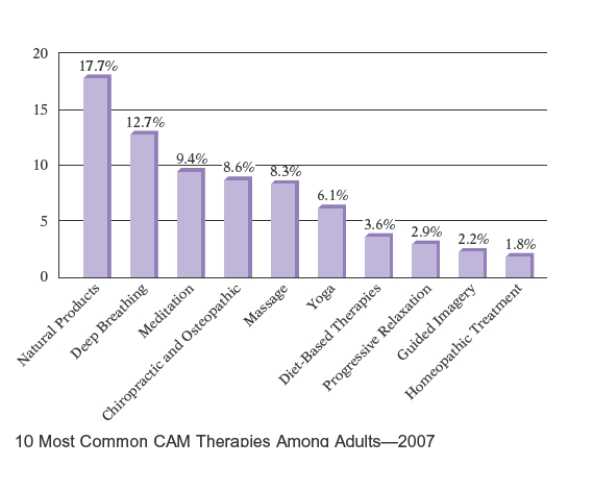
A) 59,040,000 adults
B) 99,040,000 adults
C) 79,040,000 adults
D) 69,040,000 adults
E) 89,040,000 adults
Correct Answer:
Verified
Q34: Suppose that 68 billion pounds of
Q35: What is 44.7
Q36: The statistics shown in the graph at
Q37: What is 77
Q38: What is 0.2
Q40: A commonly used artificial hip joint
Q41: A one-serving size bag of potato
Q42: In a recent clinical study, 75
Q43: An alcohol solution (alcohol and water)
Q44: If you are on a 2500-calorie
Unlock this Answer For Free Now!
View this answer and more for free by performing one of the following actions

Scan the QR code to install the App and get 2 free unlocks

Unlock quizzes for free by uploading documents