The circle graph shows the results of the student council presidential election. The complete circular area represents 100%
of the votes.
-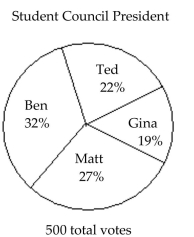 The circle graph shows what percent of the vote each person received. Who got the fewest votes?
A) Ben
B) Matt
C) Gina
D) Ted
Correct Answer:
Verified
Q17: The following pictograph shows the number of
Q18: The bar graph shows the number of
Q19: The following pictograph shows the number of
Q20: Use the information given to draw
Q21: The histogram shows the scores of each
Q23: The line graph shows the recorded hourly
Q24: The line graph shows the recorded hourly
Q25: The circle graph shows the results of
Q26: The line graph shows the recorded hourly
Q27: The circle graph shows the results of
Unlock this Answer For Free Now!
View this answer and more for free by performing one of the following actions

Scan the QR code to install the App and get 2 free unlocks

Unlock quizzes for free by uploading documents