The circle graph below shows us how an average consumer spends money. Use this information for Exercises 26 through
28. 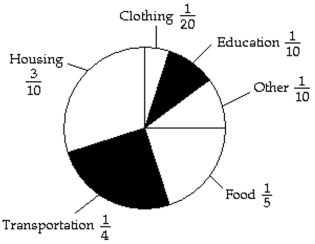
-Suppose your family spent $56,000 on the items in the graph above. How much might we expect was spent on education?
A) $4200.00
B) $5600.00
C) $2800.00
D) $4900.00
Correct Answer:
Verified
Q147: The circle graph below shows us
Q148: Solve.
-A carpenter cuts a piece 2 34
Q149: Perform the indicated operation. Simplify your
Q150: Find the perimeter of each figure.
Q151: The circle graph below shows us
Q152: Perform the indicated operation. Simplify your
Q153: Perform the indicated operation. Simplify your
Q155: Perform the indicated operation. Simplify your
Q156: Perform the indicated operation. Simplify your
Q157: Solve.
-A small airplane useA small airplane
Unlock this Answer For Free Now!
View this answer and more for free by performing one of the following actions

Scan the QR code to install the App and get 2 free unlocks

Unlock quizzes for free by uploading documents