Solve the problem.
-The table gives the number of basic cable TV subscribers (in millions) for a certain region for the years shown. a. Write this data as a set of ordered pairs of the form (year, number of basic cable TV subscribers in millions) . b. Create a scatter diagram of the data. Be sure to label the axes properly. 
A) (2000, 0.2) , (2001, 1.1) , (2002, 0.7) , (2003, 1.2) , (2004, 1.8) , (2005, 1.9) 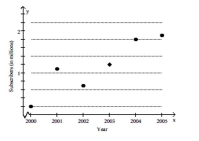
B) (0.2, 2000) , (1.1, 2001) , (0.7, 2002) , (1.2, 2003) , (1.8, 2004) , (1.9, 2005) 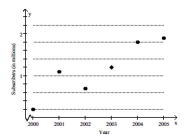
Correct Answer:
Verified
Q302: Find the slope of the line and
Q303: Solve the problem.
-The perimeter of the parallelogram
Q304: Solve.
-y varies directly as x. If y
Q305: Determine if the relation is also a
Q306: Find the equation of the line.
Q307: Determine if the relation is also a
Q308: Determine if the relation is also a
Q309: Determine if the relation is also a
Q310: Find the indicated function values.
-f(x)= 9x -
Q312: Solve.
-x varies inversely as y2. If x
Unlock this Answer For Free Now!
View this answer and more for free by performing one of the following actions

Scan the QR code to install the App and get 2 free unlocks

Unlock quizzes for free by uploading documents