The figure shows the graphs of the cost and revenue functions for a company that manufactures and sells binoculars. Use
the information in the figure to answer the question. 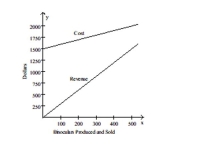
-The company's cost for manufacturing x binoculars is determined by the equation y = x + 1500. The revenue for selling x binoculars is determined by the equation y = 3x. The break-even point is the point at which the cost
And revenue equations intersect. At the break-even point both cost and revenue are what?
A) $750
B) $2700
C) $2250
D) $1500
Correct Answer:
Verified
Q30: Solve the system of equations using
Q31: Solve the system of equations using
Q32: Solve the system of equations using
Q33: Solve the system of equations using
Q34: Solve the system of equations using
Q36: Find the solution to the system
Q37: Solve the system of equations using
Q38: The figure shows the graphs of the
Q39: Solve the system of equations using
Q40: Solve the system of equations using
Unlock this Answer For Free Now!
View this answer and more for free by performing one of the following actions

Scan the QR code to install the App and get 2 free unlocks

Unlock quizzes for free by uploading documents