Multiple Choice
The total frequency of the data whose histogram is shown below is approximately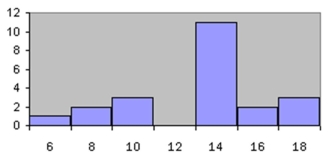
A) 11
B) 22
Correct Answer:
Verified
Related Questions
Q22: Which type of graph represents the data
Q42: Exaggerating a one-dimensional increase by showing it
Q43: Which graph should be used to represent
Q49: A time series graph is useful for
Q51: Which of the following could be a
Q52: A Pareto chart does not have which
Q53: The graphs that have their distributions as
Q56: Which of the following is a histogram?
Q57: Pareto charts have units that are used
Q58: ![]()
Unlock this Answer For Free Now!
View this answer and more for free by performing one of the following actions

Scan the QR code to install the App and get 2 free unlocks

Unlock quizzes for free by uploading documents